Phishing website detection system provides strong security mechanism to detect and prevent phishing domains from reaching user. This project presents a simple and portable approach to detect spoofed webpages and solve security vulnerabilities using Machine Learning. It can be easily operated by anyone since all the major tasks are happening in the backend. The user is required to provide URL as input to the GUI and click on submit button. The output is shown as “YES” for phishing URL and “NO” for not phished URL. PYTHON DEPENDENCIES: • NumPy, Pandas, Scikit-learn: For Data cleaning, Data analysis and Data modelling. • Pickle: For exporting the model to local machine • Tkinter, Pyqt, QtDesigner: For building up the Graphical User Interface (GUI) of the software. To avoid the pain of installing independent packages and libraries of python, install Anaconda from www.anaconda.com. It is a Python data science platform which has all the ML libraries, Data analysis libraries, Jupyter Notebooks, Spyder etc. built in it which makes it easy to use and efficient. Steps to be followed for running the code of the software: • Install anaconda in the system. • gui.py : It contains the code for the GUI and is linked to other modules of the software. • Feature_extractor.py: It contains the code of Data analysis and data modelling. • Rf_model.py: It contains the trained machine learning model. • Only gui.py is to be run to execute the whole software.
64/100 healthRecently updatedActive repository
Jupyter NotebookNo license
⑂ 22 forks◯ 1 issuesUpdated 7 days ago
BUILD YOUR OWN BLOCKCHAIN: A PYTHON TUTORIAL Download the full Jupyter/iPython notebook from Github here Build Your Own Blockchain – The Basics¶ This tutorial will walk you through the basics of how to build a blockchain from scratch. Focusing on the details of a concrete example will provide a deeper understanding of the strengths and limitations of blockchains. For a higher-level overview, I’d recommend this excellent article from BitsOnBlocks. Transactions, Validation, and updating system state¶ At its core, a blockchain is a distributed database with a set of rules for verifying new additions to the database. We’ll start off by tracking the accounts of two imaginary people: Alice and Bob, who will trade virtual money with each other. We’ll need to create a transaction pool of incoming transactions, validate those transactions, and make them into a block. We’ll be using a hash function to create a ‘fingerprint’ for each of our transactions- this hash function links each of our blocks to each other. To make this easier to use, we’ll define a helper function to wrap the python hash function that we’re using. In [1]: import hashlib, json, sys def hashMe(msg=""): # For convenience, this is a helper function that wraps our hashing algorithm if type(msg)!=str: msg = json.dumps(msg,sort_keys=True) # If we don't sort keys, we can't guarantee repeatability! if sys.version_info.major == 2: return unicode(hashlib.sha256(msg).hexdigest(),'utf-8') else: return hashlib.sha256(str(msg).encode('utf-8')).hexdigest() Next, we want to create a function to generate exchanges between Alice and Bob. We’ll indicate withdrawals with negative numbers, and deposits with positive numbers. We’ll construct our transactions to always be between the two users of our system, and make sure that the deposit is the same magnitude as the withdrawal- i.e. that we’re neither creating nor destroying money. In [2]: import random random.seed(0) def makeTransaction(maxValue=3): # This will create valid transactions in the range of (1,maxValue) sign = int(random.getrandbits(1))*2 - 1 # This will randomly choose -1 or 1 amount = random.randint(1,maxValue) alicePays = sign * amount bobPays = -1 * alicePays # By construction, this will always return transactions that respect the conservation of tokens. # However, note that we have not done anything to check whether these overdraft an account return {u'Alice':alicePays,u'Bob':bobPays} Now let’s create a large set of transactions, then chunk them into blocks. In [3]: txnBuffer = [makeTransaction() for i in range(30)] Next step: making our very own blocks! We’ll take the first k transactions from the transaction buffer, and turn them into a block. Before we do that, we need to define a method for checking the valididty of the transactions we’ve pulled into the block. For bitcoin, the validation function checks that the input values are valid unspent transaction outputs (UTXOs), that the outputs of the transaction are no greater than the input, and that the keys used for the signatures are valid. In Ethereum, the validation function checks that the smart contracts were faithfully executed and respect gas limits. No worries, though- we don’t have to build a system that complicated. We’ll define our own, very simple set of rules which make sense for a basic token system: The sum of deposits and withdrawals must be 0 (tokens are neither created nor destroyed) A user’s account must have sufficient funds to cover any withdrawals If either of these conditions are violated, we’ll reject the transaction. In [4]: def updateState(txn, state): # Inputs: txn, state: dictionaries keyed with account names, holding numeric values for transfer amount (txn) or account balance (state) # Returns: Updated state, with additional users added to state if necessary # NOTE: This does not not validate the transaction- just updates the state! # If the transaction is valid, then update the state state = state.copy() # As dictionaries are mutable, let's avoid any confusion by creating a working copy of the data. for key in txn: if key in state.keys(): state[key] += txn[key] else: state[key] = txn[key] return state In [5]: def isValidTxn(txn,state): # Assume that the transaction is a dictionary keyed by account names # Check that the sum of the deposits and withdrawals is 0 if sum(txn.values()) is not 0: return False # Check that the transaction does not cause an overdraft for key in txn.keys(): if key in state.keys(): acctBalance = state[key] else: acctBalance = 0 if (acctBalance + txn[key]) < 0: return False return True Here are a set of sample transactions, some of which are fraudulent- but we can now check their validity! In [6]: state = {u'Alice':5,u'Bob':5} print(isValidTxn({u'Alice': -3, u'Bob': 3},state)) # Basic transaction- this works great! print(isValidTxn({u'Alice': -4, u'Bob': 3},state)) # But we can't create or destroy tokens! print(isValidTxn({u'Alice': -6, u'Bob': 6},state)) # We also can't overdraft our account. print(isValidTxn({u'Alice': -4, u'Bob': 2,'Lisa':2},state)) # Creating new users is valid print(isValidTxn({u'Alice': -4, u'Bob': 3,'Lisa':2},state)) # But the same rules still apply! True False False True False Each block contains a batch of transactions, a reference to the hash of the previous block (if block number is greater than 1), and a hash of its contents and the header Building the Blockchain: From Transactions to Blocks¶ We’re ready to start making our blockchain! Right now, there’s nothing on the blockchain, but we can get things started by defining the ‘genesis block’ (the first block in the system). Because the genesis block isn’t linked to any prior block, it gets treated a bit differently, and we can arbitrarily set the system state. In our case, we’ll create accounts for our two users (Alice and Bob) and give them 50 coins each. In [7]: state = {u'Alice':50, u'Bob':50} # Define the initial state genesisBlockTxns = [state] genesisBlockContents = {u'blockNumber':0,u'parentHash':None,u'txnCount':1,u'txns':genesisBlockTxns} genesisHash = hashMe( genesisBlockContents ) genesisBlock = {u'hash':genesisHash,u'contents':genesisBlockContents} genesisBlockStr = json.dumps(genesisBlock, sort_keys=True) Great! This becomes the first element from which everything else will be linked. In [8]: chain = [genesisBlock] For each block, we want to collect a set of transactions, create a header, hash it, and add it to the chain In [9]: def makeBlock(txns,chain): parentBlock = chain[-1] parentHash = parentBlock[u'hash'] blockNumber = parentBlock[u'contents'][u'blockNumber'] + 1 txnCount = len(txns) blockContents = {u'blockNumber':blockNumber,u'parentHash':parentHash, u'txnCount':len(txns),'txns':txns} blockHash = hashMe( blockContents ) block = {u'hash':blockHash,u'contents':blockContents} return block Let’s use this to process our transaction buffer into a set of blocks: In [10]: blockSizeLimit = 5 # Arbitrary number of transactions per block- # this is chosen by the block miner, and can vary between blocks! while len(txnBuffer) > 0: bufferStartSize = len(txnBuffer) ## Gather a set of valid transactions for inclusion txnList = [] while (len(txnBuffer) > 0) & (len(txnList) < blockSizeLimit): newTxn = txnBuffer.pop() validTxn = isValidTxn(newTxn,state) # This will return False if txn is invalid if validTxn: # If we got a valid state, not 'False' txnList.append(newTxn) state = updateState(newTxn,state) else: print("ignored transaction") sys.stdout.flush() continue # This was an invalid transaction; ignore it and move on ## Make a block myBlock = makeBlock(txnList,chain) chain.append(myBlock) In [11]: chain[0] Out[11]: {'contents': {'blockNumber': 0, 'parentHash': None, 'txnCount': 1, 'txns': [{'Alice': 50, 'Bob': 50}]}, 'hash': '7c88a4312054f89a2b73b04989cd9b9e1ae437e1048f89fbb4e18a08479de507'} In [12]: chain[1] Out[12]: {'contents': {'blockNumber': 1, 'parentHash': '7c88a4312054f89a2b73b04989cd9b9e1ae437e1048f89fbb4e18a08479de507', 'txnCount': 5, 'txns': [{'Alice': 3, 'Bob': -3}, {'Alice': -1, 'Bob': 1}, {'Alice': 3, 'Bob': -3}, {'Alice': -2, 'Bob': 2}, {'Alice': 3, 'Bob': -3}]}, 'hash': '7a91fc8206c5351293fd11200b33b7192e87fad6545504068a51aba868bc6f72'} As expected, the genesis block includes an invalid transaction which initiates account balances (creating tokens out of thin air). The hash of the parent block is referenced in the child block, which contains a set of new transactions which affect system state. We can now see the state of the system, updated to include the transactions: In [13]: state Out[13]: {'Alice': 72, 'Bob': 28} Checking Chain Validity¶ Now that we know how to create new blocks and link them together into a chain, let’s define functions to check that new blocks are valid- and that the whole chain is valid. On a blockchain network, this becomes important in two ways: When we initially set up our node, we will download the full blockchain history. After downloading the chain, we would need to run through the blockchain to compute the state of the system. To protect against somebody inserting invalid transactions in the initial chain, we need to check the validity of the entire chain in this initial download. Once our node is synced with the network (has an up-to-date copy of the blockchain and a representation of system state) it will need to check the validity of new blocks that are broadcast to the network. We will need three functions to facilitate in this: checkBlockHash: A simple helper function that makes sure that the block contents match the hash checkBlockValidity: Checks the validity of a block, given its parent and the current system state. We want this to return the updated state if the block is valid, and raise an error otherwise. checkChain: Check the validity of the entire chain, and compute the system state beginning at the genesis block. This will return the system state if the chain is valid, and raise an error otherwise. In [14]: def checkBlockHash(block): # Raise an exception if the hash does not match the block contents expectedHash = hashMe( block['contents'] ) if block['hash']!=expectedHash: raise Exception('Hash does not match contents of block %s'% block['contents']['blockNumber']) return In [15]: def checkBlockValidity(block,parent,state): # We want to check the following conditions: # - Each of the transactions are valid updates to the system state # - Block hash is valid for the block contents # - Block number increments the parent block number by 1 # - Accurately references the parent block's hash parentNumber = parent['contents']['blockNumber'] parentHash = parent['hash'] blockNumber = block['contents']['blockNumber'] # Check transaction validity; throw an error if an invalid transaction was found. for txn in block['contents']['txns']: if isValidTxn(txn,state): state = updateState(txn,state) else: raise Exception('Invalid transaction in block %s: %s'%(blockNumber,txn)) checkBlockHash(block) # Check hash integrity; raises error if inaccurate if blockNumber!=(parentNumber+1): raise Exception('Hash does not match contents of block %s'%blockNumber) if block['contents']['parentHash'] != parentHash: raise Exception('Parent hash not accurate at block %s'%blockNumber) return state In [16]: def checkChain(chain): # Work through the chain from the genesis block (which gets special treatment), # checking that all transactions are internally valid, # that the transactions do not cause an overdraft, # and that the blocks are linked by their hashes. # This returns the state as a dictionary of accounts and balances, # or returns False if an error was detected ## Data input processing: Make sure that our chain is a list of dicts if type(chain)==str: try: chain = json.loads(chain) assert( type(chain)==list) except: # This is a catch-all, admittedly crude return False elif type(chain)!=list: return False state = {} ## Prime the pump by checking the genesis block # We want to check the following conditions: # - Each of the transactions are valid updates to the system state # - Block hash is valid for the block contents for txn in chain[0]['contents']['txns']: state = updateState(txn,state) checkBlockHash(chain[0]) parent = chain[0] ## Checking subsequent blocks: These additionally need to check # - the reference to the parent block's hash # - the validity of the block number for block in chain[1:]: state = checkBlockValidity(block,parent,state) parent = block return state We can now check the validity of the state: In [17]: checkChain(chain) Out[17]: {'Alice': 72, 'Bob': 28} And even if we are loading the chain from a text file, e.g. from backup or loading it for the first time, we can check the integrity of the chain and create the current state: In [18]: chainAsText = json.dumps(chain,sort_keys=True) checkChain(chainAsText) Out[18]: {'Alice': 72, 'Bob': 28} Putting it together: The final Blockchain Architecture¶ In an actual blockchain network, new nodes would download a copy of the blockchain and verify it (as we just did above), then announce their presence on the peer-to-peer network and start listening for transactions. Bundling transactions into a block, they then pass their proposed block on to other nodes. We’ve seen how to verify a copy of the blockchain, and how to bundle transactions into a block. If we recieve a block from somewhere else, verifying it and adding it to our blockchain is easy. Let’s say that the following code runs on Node A, which mines the block: In [19]: import copy nodeBchain = copy.copy(chain) nodeBtxns = [makeTransaction() for i in range(5)] newBlock = makeBlock(nodeBtxns,nodeBchain) Now assume that the newBlock is transmitted to our node, and we want to check it and update our state if it is a valid block: In [20]: print("Blockchain on Node A is currently %s blocks long"%len(chain)) try: print("New Block Received; checking validity...") state = checkBlockValidity(newBlock,chain[-1],state) # Update the state- this will throw an error if the block is invalid! chain.append(newBlock) except: print("Invalid block; ignoring and waiting for the next block...") print("Blockchain on Node A is now %s blocks long"%len(chain)) Blockchain on Node A is currently 7 blocks long New Block Received; checking validity... Blockchain on Node A is now 8 blocks long
50/100 healthActive repository
GPL-3.0
⑂ 8 forks◯ 0 issuesUpdated Dec 5, 2025
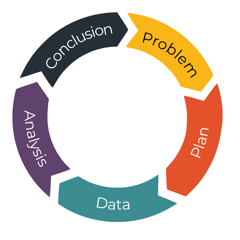
# Pandas Homework - Pandas, Pandas, Pandas ## Background The data dive continues! Now, it's time to take what you've learned about Python Pandas and apply it to new situations. For this assignment, you'll need to complete **one of two** (not both) Data Challenges. Once again, which challenge you take on is your choice. Just be sure to give it your all -- as the skills you hone will become powerful tools in your data analytics tool belt. ### Before You Begin 1. Create a new repository for this project called `pandas-challenge`. **Do not add this homework to an existing repository**. 2. Clone the new repository to your computer. 3. Inside your local git repository, create a directory for the Pandas Challenge you choose. Use folder names corresponding to the challenges: **HeroesOfPymoli** or **PyCitySchools**. 4. Add your Jupyter notebook to this folder. This will be the main script to run for analysis. 5. Push the above changes to GitHub or GitLab. ## Option 1: Heroes of Pymoli  Congratulations! After a lot of hard work in the data munging mines, you've landed a job as Lead Analyst for an independent gaming company. You've been assigned the task of analyzing the data for their most recent fantasy game Heroes of Pymoli. Like many others in its genre, the game is free-to-play, but players are encouraged to purchase optional items that enhance their playing experience. As a first task, the company would like you to generate a report that breaks down the game's purchasing data into meaningful insights. Your final report should include each of the following: ### Player Count * Total Number of Players ### Purchasing Analysis (Total) * Number of Unique Items * Average Purchase Price * Total Number of Purchases * Total Revenue ### Gender Demographics * Percentage and Count of Male Players * Percentage and Count of Female Players * Percentage and Count of Other / Non-Disclosed ### Purchasing Analysis (Gender) * The below each broken by gender * Purchase Count * Average Purchase Price * Total Purchase Value * Average Purchase Total per Person by Gender ### Age Demographics * The below each broken into bins of 4 years (i.e. <10, 10-14, 15-19, etc.) * Purchase Count * Average Purchase Price * Total Purchase Value * Average Purchase Total per Person by Age Group ### Top Spenders * Identify the the top 5 spenders in the game by total purchase value, then list (in a table): * SN * Purchase Count * Average Purchase Price * Total Purchase Value ### Most Popular Items * Identify the 5 most popular items by purchase count, then list (in a table): * Item ID * Item Name * Purchase Count * Item Price * Total Purchase Value ### Most Profitable Items * Identify the 5 most profitable items by total purchase value, then list (in a table): * Item ID * Item Name * Purchase Count * Item Price * Total Purchase Value As final considerations: * You must use the Pandas Library and the Jupyter Notebook. * You must submit a link to your Jupyter Notebook with the viewable Data Frames. * You must include a written description of three observable trends based on the data. * See [Example Solution](HeroesOfPymoli/HeroesOfPymoli_starter.ipynb) for a reference on expected format. ## Option 2: PyCitySchools  Well done! Having spent years analyzing financial records for big banks, you've finally scratched your idealistic itch and joined the education sector. In your latest role, you've become the Chief Data Scientist for your city's school district. In this capacity, you'll be helping the school board and mayor make strategic decisions regarding future school budgets and priorities. As a first task, you've been asked to analyze the district-wide standardized test results. You'll be given access to every student's math and reading scores, as well as various information on the schools they attend. Your responsibility is to aggregate the data to and showcase obvious trends in school performance. Your final report should include each of the following: ### District Summary * Create a high level snapshot (in table form) of the district's key metrics, including: * Total Schools * Total Students * Total Budget * Average Math Score * Average Reading Score * % Passing Math (The percentage of students that passed math.) * % Passing Reading (The percentage of students that passed reading.) * % Overall Passing (The percentage of students that passed math **and** reading.) ### School Summary * Create an overview table that summarizes key metrics about each school, including: * School Name * School Type * Total Students * Total School Budget * Per Student Budget * Average Math Score * Average Reading Score * % Passing Math (The percentage of students that passed math.) * % Passing Reading (The percentage of students that passed reading.) * % Overall Passing (The percentage of students that passed math **and** reading.) ### Top Performing Schools (By % Overall Passing) * Create a table that highlights the top 5 performing schools based on % Overall Passing. Include: * School Name * School Type * Total Students * Total School Budget * Per Student Budget * Average Math Score * Average Reading Score * % Passing Math (The percentage of students that passed math.) * % Passing Reading (The percentage of students that passed reading.) * % Overall Passing (The percentage of students that passed math **and** reading.) ### Bottom Performing Schools (By % Overall Passing) * Create a table that highlights the bottom 5 performing schools based on % Overall Passing. Include all of the same metrics as above. ### Math Scores by Grade\*\* * Create a table that lists the average Math Score for students of each grade level (9th, 10th, 11th, 12th) at each school. ### Reading Scores by Grade * Create a table that lists the average Reading Score for students of each grade level (9th, 10th, 11th, 12th) at each school. ### Scores by School Spending * Create a table that breaks down school performances based on average Spending Ranges (Per Student). Use 4 reasonable bins to group school spending. Include in the table each of the following: * Average Math Score * Average Reading Score * % Passing Math (The percentage of students that passed math.) * % Passing Reading (The percentage of students that passed reading.) * % Overall Passing (The percentage of students that passed math **and** reading.) ### Scores by School Size * Repeat the above breakdown, but this time group schools based on a reasonable approximation of school size (Small, Medium, Large). ### Scores by School Type * Repeat the above breakdown, but this time group schools based on school type (Charter vs. District). As final considerations: * Use the pandas library and Jupyter Notebook. * You must submit a link to your Jupyter Notebook with the viewable Data Frames. * You must include a written description of at least two observable trends based on the data. * See [Example Solution](PyCitySchools/PyCitySchools_starter.ipynb) for a reference on the expected format. ## Hints and Considerations * These are challenging activities for a number of reasons. For one, these activities will require you to analyze thousands of records. Hacking through the data to look for obvious trends in Excel is just not a feasible option. The size of the data may seem daunting, but pandas will allow you to efficiently parse through it. * Second, these activities will also challenge you by requiring you to learn on your feet. Don't fool yourself into thinking: "I need to study pandas more closely before diving in." Get the basic gist of the library and then _immediately_ get to work. When facing a daunting task, it's easy to think: "I'm just not ready to tackle it yet." But that's the surest way to never succeed. Learning to program requires one to constantly tinker, experiment, and learn on the fly. You are doing exactly the _right_ thing, if you find yourself constantly practicing Google-Fu and diving into documentation. There is just no way (or reason) to try and memorize it all. Online references are available for you to use when you need them. So use them! * Take each of these tasks one at a time. Begin your work, answering the basic questions: "How do I import the data?" "How do I convert the data into a DataFrame?" "How do I build the first table?" Don't get intimidated by the number of asks. Many of them are repetitive in nature with just a few tweaks. Be persistent and creative! * Expect these exercises to take time! Don't get discouraged if you find yourself spending hours initially with little progress. Force yourself to deal with the discomfort of not knowing and forge ahead. Consider these hours an investment in your future! * As always, feel encouraged to work in groups and get help from your TAs and Instructor. Just remember, true success comes from mastery and _not_ a completed homework assignment. So challenge yourself to truly succeed! ### Copyright Trilogy Education Services © 2019. All Rights Reserved.
A Model Context Protocol server for working with Jupyter Notebooks (.ipynb files) in a way that is efficient for Large Language Models (LLMs). It converts notebooks to a simplified plain text format to reduce token usage and cost, and can convert them back.
44/100 healthActive repository
PythonNo license
⑂ 1 forks◯ 0 issuesUpdated Mar 31, 2026
India GDP Analysis Problem Description - I NITI Aayog: Background NITI Aayog (National Institution for Transforming India) is a policy think tank of the Government of India; it provides strategic inputs to the central and the state governments to achieve various development goals. In the past, NITI Aayog has played an important role in initiatives such as Digital India, Atal Innovation Mission and various agricultural reforms and have designed various policies in education, skill development, water management, healthcare, etc. NITI Aayog was established to replace the Planning Commission of India, which used to follow a top-down model for policy making, i.e., it typically designed policies at the central level (such as the 5-year plans). On the other hand, NITI Aayog designs policies specific to the different states or segments of the economy. Finance Minister, Arun Jaitley, made the following observation on the necessity of creating NITI Aayog, "The 65-year-old Planning Commission had become a redundant organisation. It was relevant in a command economy structure, but not any longer. India is a diversified country and its states are in various phases of economic development along with their own strengths and weaknesses. In this context, a ‘one size fits all’ approach to economic planning is obsolete...". Project Brief We are working as the chief data scientist at NITI Aayog, reporting to the CEO. The CEO has initiated a project wherein the NITI Aayog will provide top-level recommendations to the Chief Ministers (CMs) of various states, which will help them prioritise areas of development for their respective states. Since different states are in different phases of development, the recommendations should be specific to the states. The overall goal of this project is to help the CMs focus on areas that will foster economic development for their respective states. Since the most common measure of economic development is the GDP, we will analyse the GDP of the various states of India and suggest ways to improve it. Understanding GDP Gross domestic product (GDP) at current prices is the GDP at the market value of goods and services produced in a country during a year. In other words, GDP measures the 'monetary value of final goods and services produced by a country/state in a given period of time'. GDP can be broadly divided into goods and services produced by three sectors: the primary sector (agriculture), the secondary sector (industry), and the tertiary sector (services). It is also known as nominal GDP. More technically, (real) GDP takes into account the price change that may have occurred due to inflation. This means that the real GDP is nominal GDP adjusted for inflation. We will use the nominal GDP for this exercise. Also, we will consider the financial year 2015-16 as the base year, as most of the data required for this exercise is available for the aforementioned period. Per Capita GDP and Income Total GDP divided by the population gives the per capita GDP, which roughly measures the average value of goods and services produced per person. The per capita income is closely related to the per capita GDP (though they are not the same). In general, the per capita income increases when the per capita GDP increases, and vice-versa. For instance, in the financial year 2015-16, the per capita income of India was ₹93,293, whereas the per capita GDP of India was $1717, which roughly amounts to ₹1,11,605. Problem Description - II Data The data is sourced from https://data.gov.in/, an Open Government Data (OGD) platform of India. The download instructions are provided in the next segment. The data for GDP analysis of the Indian states is divided into two parts: Data I-A: This dataset consists of the GSDP (Gross State Domestic Product) data for the states and union territories. Data I-B: This dataset contains the distribution of GSDP among three sectors: the primary sector (agriculture), the secondary sector (industry) and the tertiary sector (services) along with taxes and subsidies. There is separate dataset for each of the states. We are expected to read the dataset for the available states and join these (in Python) if needed. There are two parts to this project. In the first part, we will analyse and compare the GDPs of various Indian states (both total and per capita). The GDP of a state is referred to as the GSDP (Gross State Domestic Product). Then, we will divide the states into four categories based on the GDP per capita, and for each of these four categories, we will analyse the sectors that contribute the most to the GDP (such as agriculture, real estate, manufacturing, etc.). In the second part, we will analyse whether GDP per capita is related to dropout rates in schools and colleges. Part-I: GDP Analysis of the Indian States For each of the following steps of analysis, choose an appropriate type of plot for comparing the data. Also, ensure that the plots are in increasing or decreasing order for better comparison. For example, if we make a bar plot to compare the GDPs of the states, ensure that the bars are in either increasing or decreasing order of GDP. Part I-A: For the analysis below, use the Data I-A. First, we need to load the data in Python properly and then clean it. This also involves the treatment of missing values, we can choose to drop the row or column as well. Remember this will affect our next analysis and results drastically. Plot a graph for rows " % Growth over previous year" for all the states (not union territories) whose data is available, use as much data as possible for this exercise. Use the best fit line to represent the growth for each state. Draw a similar line graph for the nation as well. How will we compare the growth rates of any two states? Which states have been growing consistently fast, and which ones have been struggling? Rank top 3 fastest and 3 slowest-growing states. What is the Nation's growth rate? What has been the growth rate of my home state, and how does it compare to the national growth rate? Plot the total GDP of the states for the year 2015-16: Which Plot will we use for this? Why? (Remeber to plot the graph in a way such as it is easier to read and compare) Identify the top 5 and the bottom 5 states based on total GDP. What insights can we draw from this graph? What states are performing poorly? (Remember: this will not be solely based on total GDP) Part I-B: For the analysis below, use Data I-B. We can also use Data I-B along with Data I-A if required. Also, perform the analysis only for the duration 2014-15. Filter out the union territories (Delhi, Chandigarh, Andaman and Nicobar Islands, etc.) for further analysis, as they are governed directly by the central, not state governments. Plot the GDP per capita for all the states. Identify the top 5 and the bottom 5 states based on the GDP per capita. Find the ratio of the highest per capita GDP to the lowest per capita GDP. Plot the percentage contribution of the primary, secondary and tertiary sectors as a percentage of the total GDP for all the states. Which plot will we use here? Why? Why is (Primary + Secondary + Tertiary) not equal to total GDP? Can we draw any insight from this? Find correlation of percentile of the state (% of states with lower per capita GDP) and %contribution of Primary sector to total GDP. Categorise the states into four groups based on the GDP per capita (C1, C2, C3, C4, where C1 would have the highest per capita GDP and C4, the lowest). The quantile values are (0.20,0.5, 0.85, 1), i.e., the states lying between the 85th and the 100th percentile are in C1; those between the 50th and the 85th percentiles are in C2, and so on. Note: Categorisation into four groups will simplify the subsequent analysis, as otherwise, comparing the data of all the states would become quite exhaustive. For each category (C1, C2, C3, C4): Find the top 3/4/5 sub-sectors (such as agriculture, forestry and fishing, crops, manufacturing etc., not primary, secondary and tertiary) that contribute to approximately 80% of the GSDP of each category. Note-I: The nomenclature for this project is as follows: primary, secondary and tertiary are named 'sectors', while agriculture, manufacturing etc. are named 'sub-sectors'. Note-II: If the top 3 sub-sectors contribute to, say, 79% of the GDP of some category, we can report "These top 3 sub-sectors contribute to approximately 80% of the GDP". This is to simplify the analysis and make the results consumable. (Remember, the CEO has to present the report to the CMs, and CMs have limited time; so, the analysis needs to be sharp and concise.) Plot the contribution of the sub-sectors as a percentage of the GSDP of each category. Now that we have summarised the data in the form of plots, tables, etc., try to draw non-obvious insights from it. Think about questions such as: How does the GDP distribution of the top states (C1) differ from the others? Which sub-sectors seem to be correlated with high GDP? Which sub-sectors do the various categories need to focus on? Ask other such relevant questions, which we think are important, and note we insights for category separately. More insights are welcome and will be awarded accordingly. Finally, provide at least two recommendations for each category to improve the per capita GDP. Part-II: GDP and Education Dropout Rates In Part-I, we would have noticed that (one) way to increase per capita GDP is by shifting the distribution of GDP towards the secondary and tertiary sectors, i.e., the manufacturing and services industries. But these industries can thrive only when there is an availability of educated and skilled labour. In this part of the analysis, we will investigate whether there is any relationship between per capita GDP with dropout rates in education. Data Data II: This section will require the dropout rate dataset apart from the dataset that we used in Part-1 of the case study. Download instructions are provided in the next segment. Part-II: GDP and Education Analyse if there is any correlation of GDP per capita with dropout rates in education (primary, upper primary and secondary) for the year 2014-2015 for each state. Choose an appropriate plot to conduct this analysis. Is there any correlation between dropout rate and %contribution of each sector (Primary, Secondary and Tertiary) to the total GDP? We have the total population of each state from the data in part I. Is there any correlation between dropout rates and population? What is the expected trend and what is the observation? Write down the key insights we draw from this data: Form at least one reasonable hypothesis for the observations from the data About GDP analysis for India in the year for 2015-16 and recommendation for the individual states for increasing the GDP by focusing on various factor. Topics python statistical-analysis data-analysis gdp-analysis Resources Readme Stars 0 stars Watchers 1 watching Forks 0 forks Releases No releases published Packages No packages published Languages Jupyter Notebook 100.0% Footer © 2022 GitHub, Inc. Footer navigation Terms Privacy Security Status Docs Contact GitHub Pricing API Training Blog About
nteract Jupyter Notebook with Node.js Kernel Examples (aka How fun it is)
43/100 healthActive repository
Jupyter NotebookMIT#javascript#jupyter-notebook#nodejs#nteract
⑂ 1 forks◯ 0 issuesUpdated Jun 24, 2020