Loading repository data…
paulknewton / repository
covid-ml
Analyses publicly available data on the COVID-19 pandemic and identifies trends and patterns using a Jupyter live notebook and the pandas data analysis framework. Shows how python can be used to analyse data sets and present results in ways that can be easily understood.
#coronavirus#covid-19#jupyter-notebook#pandas#python
Live repository statistics
★ 3Stars
⑂ 1Forks
◯ 13Open issues
◉ 3Watchers
23/100
OPENREPOHUB HEALTH SIGNAL
Limited signals
A transparent discovery signal based on current public GitHub metadata.
Recent activity35% weight
10
Community adoption25% weight
7
Maintenance state20% weight
40
License clarity10% weight
0
Project information10% weight
100
This score does not audit code, security, maintainers, documentation quality, or suitability. Verify the repository and its current documentation before adoption.
README preview
COVID-ML
This project analyses publicly available data on the COVID-19 pandemic and identifies trends and patterns using the pandas data analysis framework.
- The project is written as a Jupyter notebook using pandas here. Github will render a static version. If you want to execute the notebook dynamically, you will need to download it locally (see instructions below).
- A HTML version is updated on an hourly basis here
- A basic dashboard only including main graphs is updated hourly here
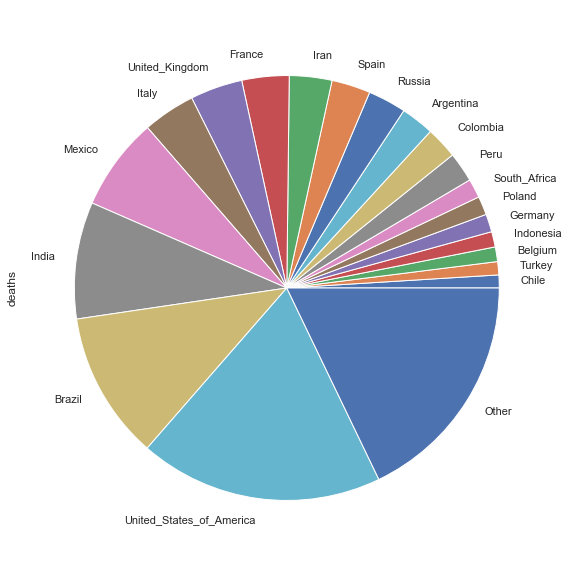
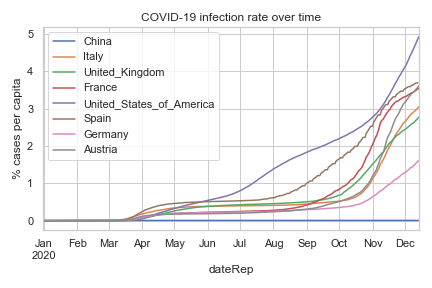
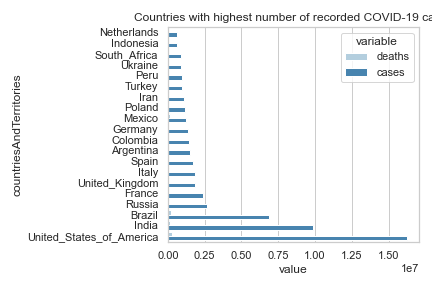
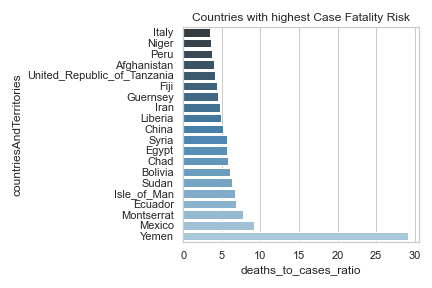
Examples of graphs that are produced:
Countries With Highest Number Of Recorded Covid-19 Deaths Vs Rest Of World
Covid-19 Infection Rate Over Time
Countries With Highest Number Of Recorded Covid-19 Cases
Countries With Highest Case Fatality Risk
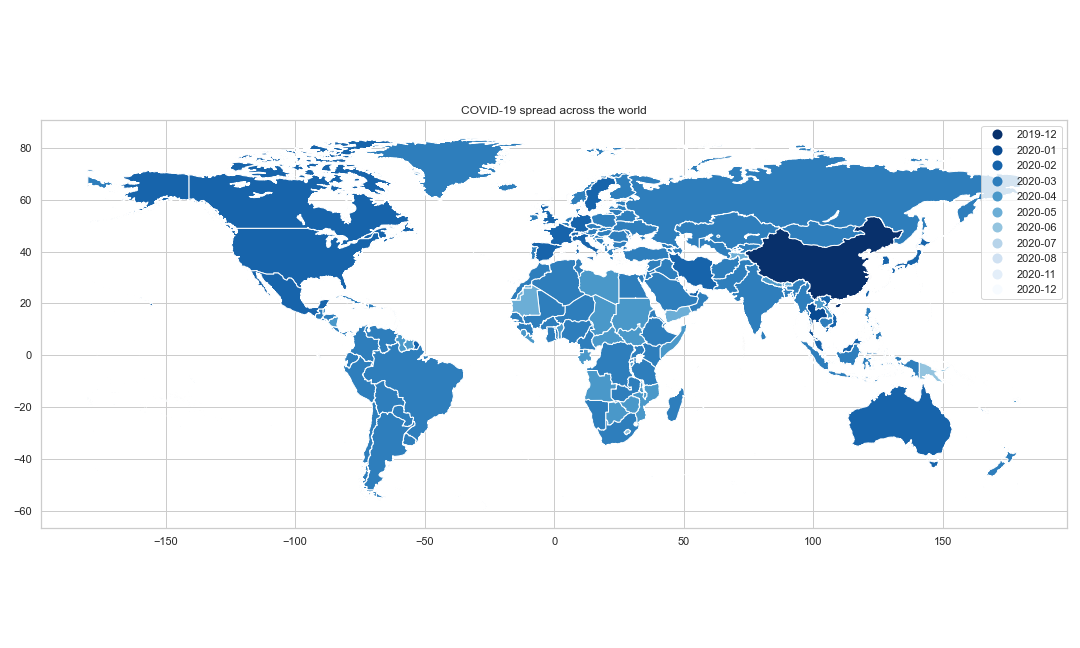
COVID-19 Spread Across The World
Installation
The data runs inside a Jupyter notebook. Make sure you install the core Jupyter runtime as well as the following libraries:
- pandas - the core data manipulation
- sklearn (optional) - was used for normalisation scaling but no longer needed
- matplotlib - for plotting the data
- xlrd - used by pandas to read the raw data in Excel
- geoplot - used to draw world maps
- pyyaml - used to generate some data files in YAML format for the Jekyll web site
- seaborn - improves the look and feel of the graphs